Introduction
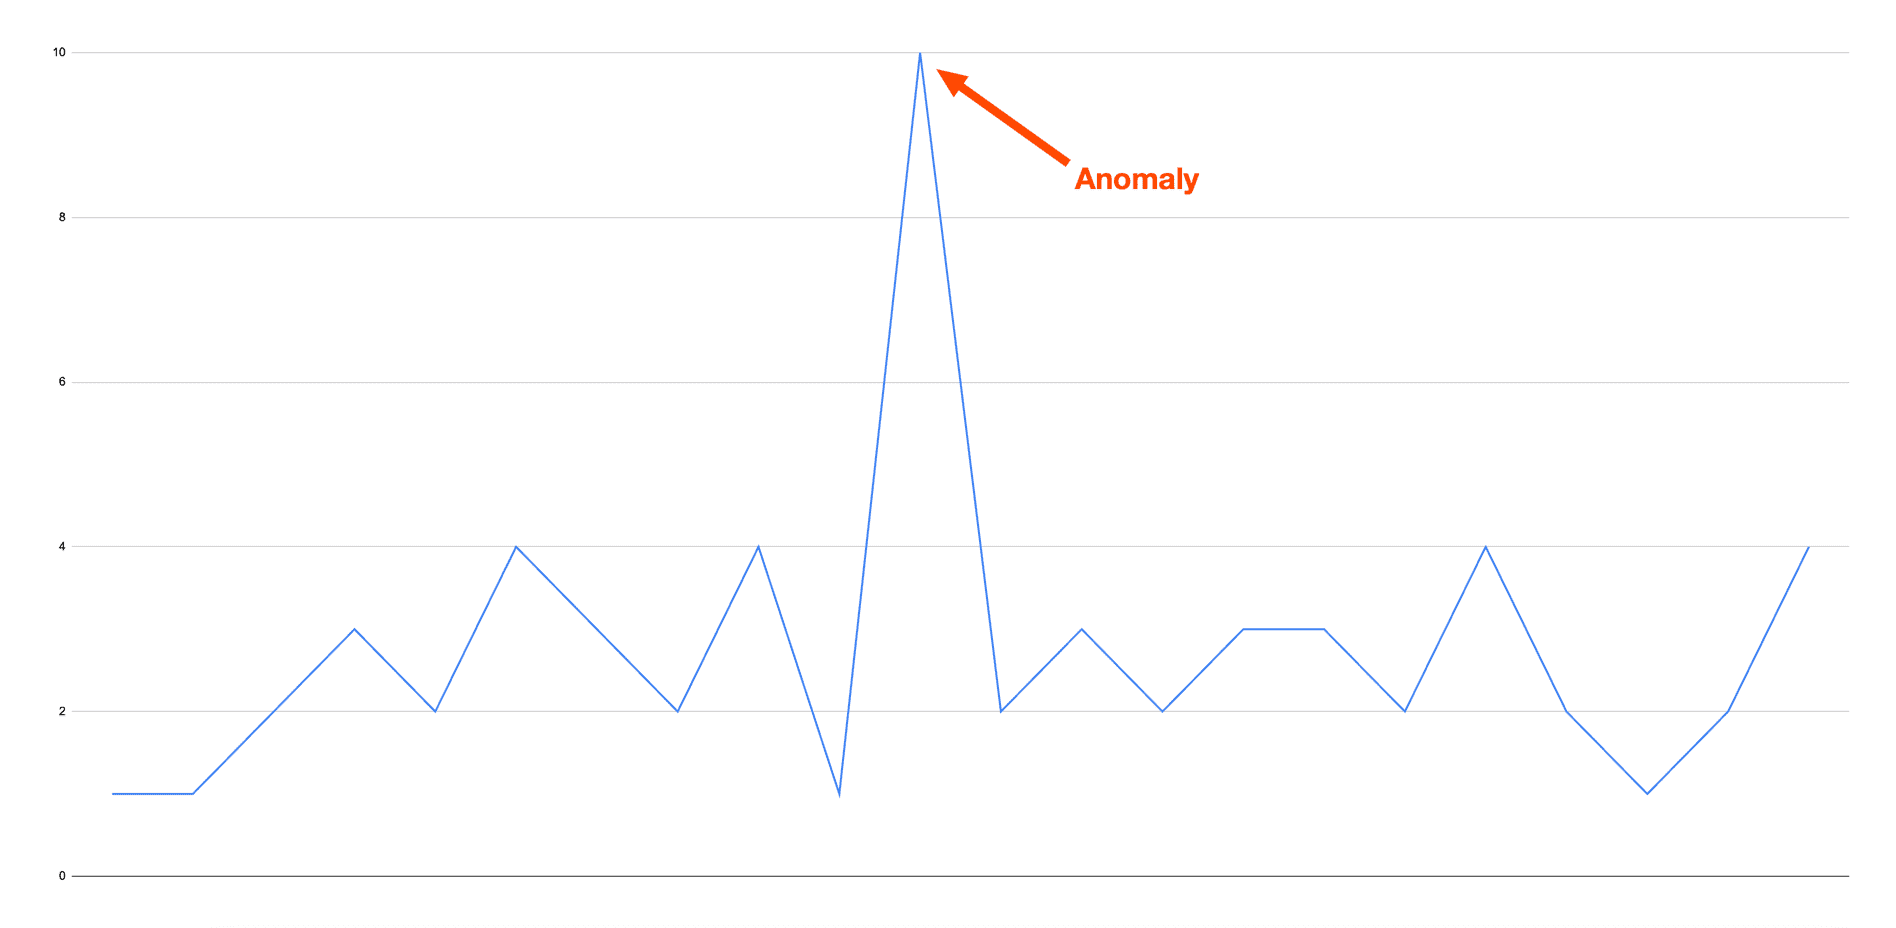
Anomaly Detection can get intimidating when you hear it for the first time. You probably think about mathematical standard deviation calculations or just a hard process to set up. But it doesn’t have to be when you look at what it essentially is. It is the identification of unusual events in your data, such as an unusual amount of activity. This is exactly what we did here at Knack. We tackled the problem from the ground up and had a proof of concept ready in no time. In this blog post, I’ll walk you through the process of how we built a simple yet effective anomaly detection process.
Anomaly Detection at Knack
When we started to realize we want to capture those unusual events from users, we got to work. I was tasked with figuring out a simple, yet effective process that allows us to capture this type of data. Initially, we had this process in our Business Intelligence (BI) tool within Metabase. This was very tedious as it required manual execution of the dashboard, there was no alerting, and there was no automation. These were all pain points that our Operations team had voiced. The Metabase dashboard only had a few queries with parameters that we identified as being outside the norm. To identify what was outside the norm, we took a look at user behavior in our data and ran a manual analysis. This allowed us to query specifically on the data and detect those anomalies.
I started researching how best to achieve anomaly detection and quickly realized that a lot of solutions that I saw were going to take a heavy lift to get off the ground. I took a step back and looked at how I could incorporate a method of anomaly detection into our current data pipeline. On a high level, our data pipeline, consists of Meltano and Airflow. Meltano and Airflow enable us to run DAGs (Directed Acyclic Graphs) on a certain schedule, which will solve one of our pain points, automation. Having that piece in order already, all I needed to think about was how I can detect those anomalies. I asked myself, how can I incorporate the anomalies that we already have on our Metabase dashboard? I can use the already defined anomalies with their parameters to write an SQL query to capture those. This is where I went from research to come up with a path forward. As mentioned above, these anomaly parameters were defined by manual analysis. I did come up with my own as well to check and query for. I started writing queries and testing them on our staging data. After I finished writing and validating those queries, I was ready to tackle the next step. How can we run this on an automated schedule?
We’re already running our ETL pipeline on a set schedule. I looked at how I can incorporate anomaly detection into that workflow. As described above, we use Airflow to orchestrate our ELT pipeline. Airflow is used widely in the industry and works great for our data needs. I knew we can schedule to run these queries on a set schedule through airflow. I had to figure out, what was the best way to run and write the logic to store the results. I had to figure out how to run these queries and save the outputs in a table for others to review and access. As I was familiar with Data Analysis Notebooks from College, I looked at a Jupyter Notebook environment. For those who aren’t familiar with Jupyter Notebooks, these are documents that are human-readable that contain computer code, descriptions, and other types to run data analysis. This allowed me to organize the anomaly detection logic into a more human-readable format. To run this Jupyter notebook on a cadence, I used the Papermill Operator by Airflow. This operator allows us to execute this Jupyter notebook on a set schedule. This was very easy to set up since we will be running a Jupyter notebook to organize the queries, manipulate the results to a standardized format, and upload the data. Since our Operations team uses Notion for their day-to-day work and their standard operating procedures, I wanted to upload the data there for them to be able to review and incorporate it into their workflow. Knack uses Notion for a lot of our standard operating procedures, capturing user feedback, and general area for a lot of our information.
Jupyter Notebook Setup
I set up this process into two different Jupyter notebooks to break up the queries and data manipulation part and the upload process. These two depend on each other, meaning the data upload notebook won’t run unless the anomaly detection notebook ran first. This allowed me to separate these two processes. One challenge I faced was how to pass the captured data to the upload notebook to use. For this, I found out that Python has a package called storemagic, which is used for lightweight persistence. It stores the data in an IPython database. This allows us to store and reference the anomaly data in the other notebook to upload it.
Initial problems with the setup
To fit in our workflow, I had the requirement to push this data to a Notion Database. To make this work, I used the Notion API, which was very easy to use. I also decided it was a good idea to load this data into our data warehouse, for further analysis. For this, I decided to use two independent loops. This decision proved to be problematic once I deployed this to production. Essentially, if one of the for loops fails, due to edge cases or bugs, the other for loop would not run. This was the case shortly after we deployed it to production. The data was uploaded to Notion but failed to run the insert statement into our database. I had to manually investigate why the insert statement failed and it was due to a single quotation mark in a name since there was no handling of escaping characters. Once this happened, I adjusted the insert statement to be more robust. Instead of using the raw insert statement, I used a class and made SQLAlchemy handle escaping characters automatically. This proved to fix the problem.
The future of our Anomaly Process
For this process to continue to evolve, I have a few improvements I want to make. These include creating a better structure for uploading the data into our database and Notion database. I’m envisioning uploading the data into our data warehouse first and then running a separate process to upload it to Notion. The operations team currently reviews and adds information to the Notion database, but we currently don’t update those entries in our database. So I want to create a back-sync functionality that will look at edited entries and update those in our data warehouse.
As you can see, anomaly detection doesn’t have to be complicated at all. We took a simple approach and it’s working for us. We still have improvements to make and continue to evolve our approach. But for anyone starting out to find anomalies, this is a perfect way to start.